In the world of investing, information is power. For years, retail investors have been at a disadvantage compared to professionals using $24,000 terminals (such as Bloomberg or FactSet). But that has changed.
Today, we take an in-depth look at TIKR Terminal, a platform founded by former Wall Street analysts with a clear vision: to democratize access to institutional-grade financial data.
If you’re looking for a tool to perform serious fundamental analysis, study historical metrics, and track what major funds are doing, keep reading.
.
1. What Is TIKR and Why Is It Different?
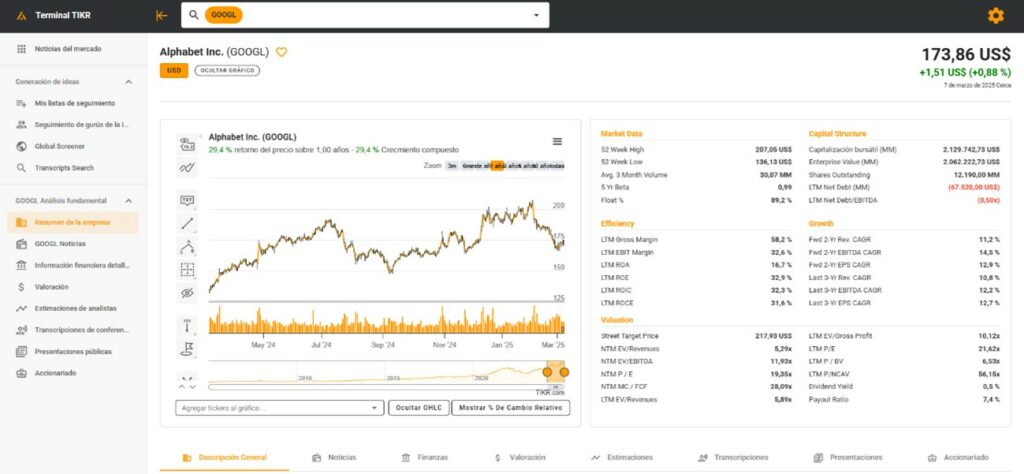
TIKR is a financial analysis platform that centralizes detailed data on publicly traded companies worldwide. Its main strength lies in depth: it doesn’t just scratch the surface, but provides full financial statements, valuation metrics, and analyst consensus data.
Its origin says it all: it was created by financial data experts to solve the lack of high-quality, affordable tools for retail investors.
.
2. The 5 Key Features of TIKR 🛠️
TIKR is much more than just a “stock screener.” Here’s what’s under the hood:
.
🌍 2.1 Global Database (+100,000 Companies)
Unlike tools such as Yahoo Finance, which often fall short in international markets, TIKR covers:
•Major Markets:NYSE, Nasdaq
•Global Markets:Europe, Asia, and Emerging Markets
•Small-Cap Companies:Covers companies that many free tools overlook
.
📉 2.2 Historical Financial Data (15 Years)
To truly understand a business, you need to see how it performed during past crises. TIKR provides:
• Full financial statements (Income Statement, Balance Sheet, Cash Flow)
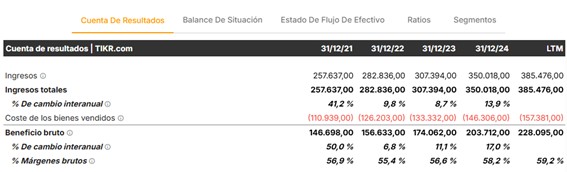
• Automatic valuation ratios (P/E, P/B, EV/EBITDA)
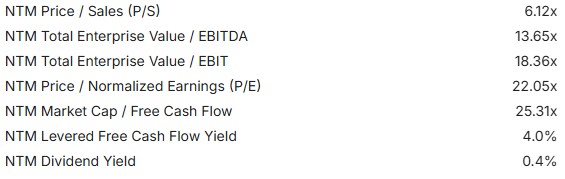
• Historical data going back up to 15 years
.
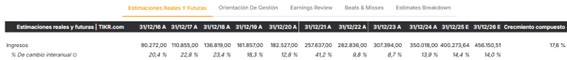
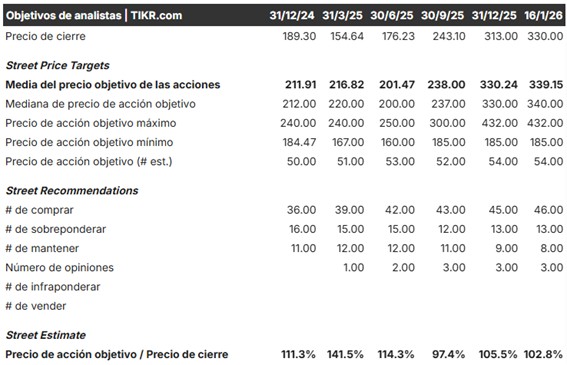
🗣️ 2.3 Analyst Consensus
What does Wall Street think? TIKR aggregates professional analyst estimates to offer:
• Revenue and earnings forecasts
• Consensus recommendations (Buy / Hold / Sell)
• Historical performance comparisons versus expectations
.
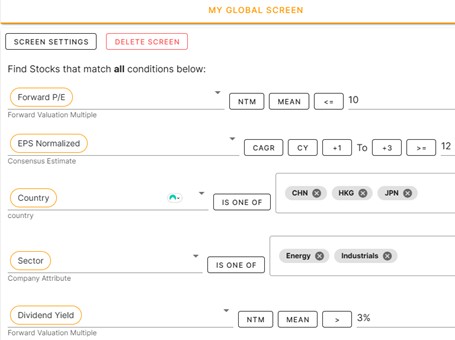
🔍 2.4 Advanced Screener and Filters
You can filter the entire market using more than 50 metrics. Examples of searches you can run:
• “Companies with revenue growth > 15% per year”
• “Stocks with a P/E ratio below their sector average”
• “Companies with high EBITDA margins and low debt”
.
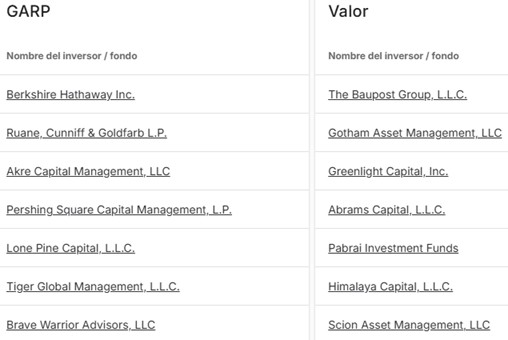
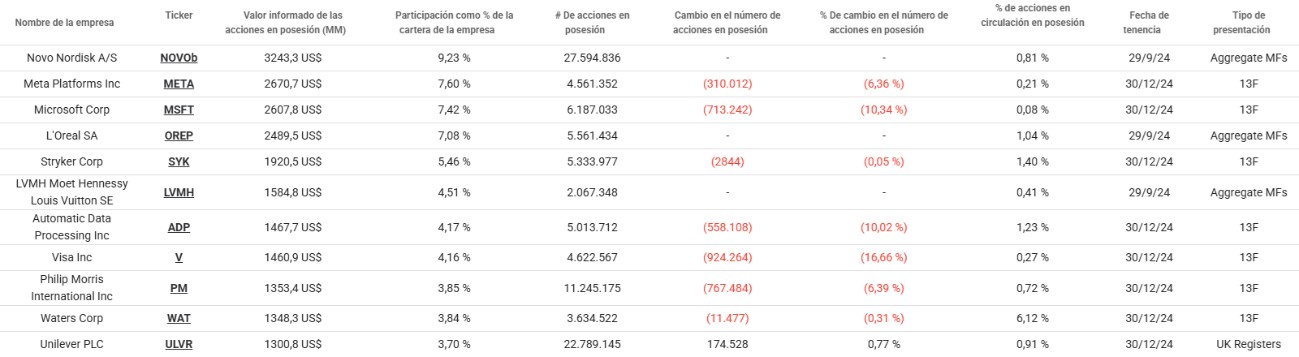
🐋 3. The Crown Jewel: ‘Superinvestor’ Tracking
This is arguably the favorite feature for many users. TIKR allows you to view the portfolios of legendary funds such as Berkshire Hathaway (Warren Buffett) or Pershing Square (Bill Ackman).
.
TIKR vs. the Competition
You may already know other websites that offer similar features, but here’s the real difference:
| Tool | What It Offers | Limitation |
|---|---|---|
| Dataroma | Simple interface for 13F filings | Stocks only, U.S. only |
| WhaleWisdom | Stocks and options | U.S. only |
| TIKR Terminal | All global markets | Stocks only |
💡 The Winning Combo: For optimal analysis, many investors combine WhaleWisdom + TIKR.
.
4. Pricing and Plans 💰
Although TIKR is a premium tool, it offers a scalable pricing model:
•Free Plan ($0):Ideal for getting started. Limited data and basic analysis.
•TIKR Plus ($10–$15/month):Full access to financial statements, the advanced screener, and analyst consensus.
•TIKR Pro ($30–$50/month): Designed for power users. Includes Excel exports, advanced hedge fund tracking, and deep valuation data.
(Note: The free version is sufficient for most casual investors.)
.
5. Pros and Cons (Honest Analysis) ✅❌
Pros:
✅ Global Coverage: Find data on companies from anywhere in the world.
✅ Depth: 15 years of financial history is a luxury for fundamental analysis.
✅ Interface: Much more user-friendly and intuitive than Bloomberg or Reuters.
✅ Institutional Tracking: See where major funds are investing on a global scale.
Cons:
❌ Paid Features: The most powerful tools (such as Excel exports) require a subscription.
❌ Not for Trading: If you’re looking for millisecond-level data for intraday trading, this isn’t the right tool.
❌ Limited Macro Coverage: Focuses on company financials, leaving out macroeconomic news or qualitative analysis (such as Seeking Alpha-style content).
.
6. Practical Tutorial: How to Use TIKR Step by Step 🚀
Si decides probar la herramienta, te recomendamos este flujo de trabajo para tomar mejores decisiones de inversión:
Step 1: Create Your Watchlist. As soon as you log in, add the companies you’re interested in. This way, you’ll receive notifications about financial updates and changes in analyst projections.
Step 2: Use the Screener. Don’t look for needles in a haystack. Set filters to find undervalued stocks (e.g., low P/E) or high-growth companies. Always compare results against the sector average.
Step 3: Analyze Valuation. Open the company profile. Check current valuation ratios and compare them with the company’s own history over the past 5 or 10 years. Is it expensive or cheap relative to its past?
Step 4: Review the ‘Gurus’ Go to the funds section. Identify what major managers are investing in and look for overlaps. If several high-quality funds are buying the same stock, it’s a signal worth investigating.

.
📥Access to TIKR (Invitation Required)
Currently, TIKR operates primarily through an invitation-based system to manage access to its data servers.
This is not a promotion—it’s simply how the platform works. If you want to gain access and start exploring the data today, you can use our direct invitation link:
![]()